Histogram
A histogram is a graphical representation of the distribution of numerical data. This can be used when working with a lot of data. The purpose of a histogram is to graphically summarize the distribution of a data set.
In fact, this representation is a specialized version of the bar chart used in excel. The possible values of the selected variable are represented on the horizontal axis. Frequencies are represented on the vertical axis.
Individual data are grouped into classes so that we get an idea of how often the data occurs in each class.
The histogram is a very often used tool when working with continuous data. It shows the position, shape and variation of the data. It also helps us observe changes in processes and is used to clarify Process Capability.
To build a histogram we must follow the steps:
Graf 0
Graf 1
Of course there are other forms of histograms such as:
Graf 4
The histogram is one of the seven basic tools of quality control.
In fact, this representation is a specialized version of the bar chart used in excel. The possible values of the selected variable are represented on the horizontal axis. Frequencies are represented on the vertical axis.
Individual data are grouped into classes so that we get an idea of how often the data occurs in each class.
The histogram is a very often used tool when working with continuous data. It shows the position, shape and variation of the data. It also helps us observe changes in processes and is used to clarify Process Capability.
To build a histogram we must follow the steps:
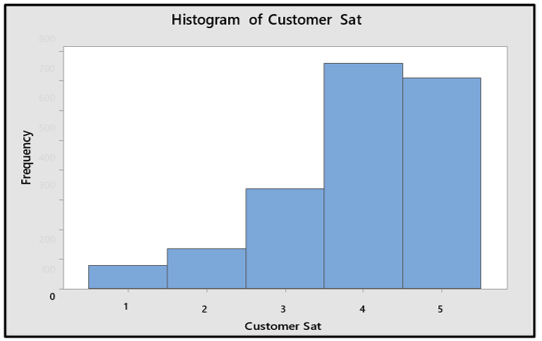
- Plot and name the x-axis and y-axis. In the case of Graph 0, the x-axis is called "Customer satisfaction" and the y-axis is called "frequency %";
Graf 0
- Choose the number of classes (also called intervals or bins) and name them. For the chosen example grouping into 5 is a good alternative.
- Count how many elements are in each class and then draw a rectangle on the graph that corresponds to the percentage of the total in that class. In this dataset, the first class (1) has 79 items, class (2) has 134, class (3) has 338, and so on. All these steps become only theory if we use MINITAB, because the histogram is built by it (see Graph 0).
Graf 1
Of course there are other forms of histograms such as:
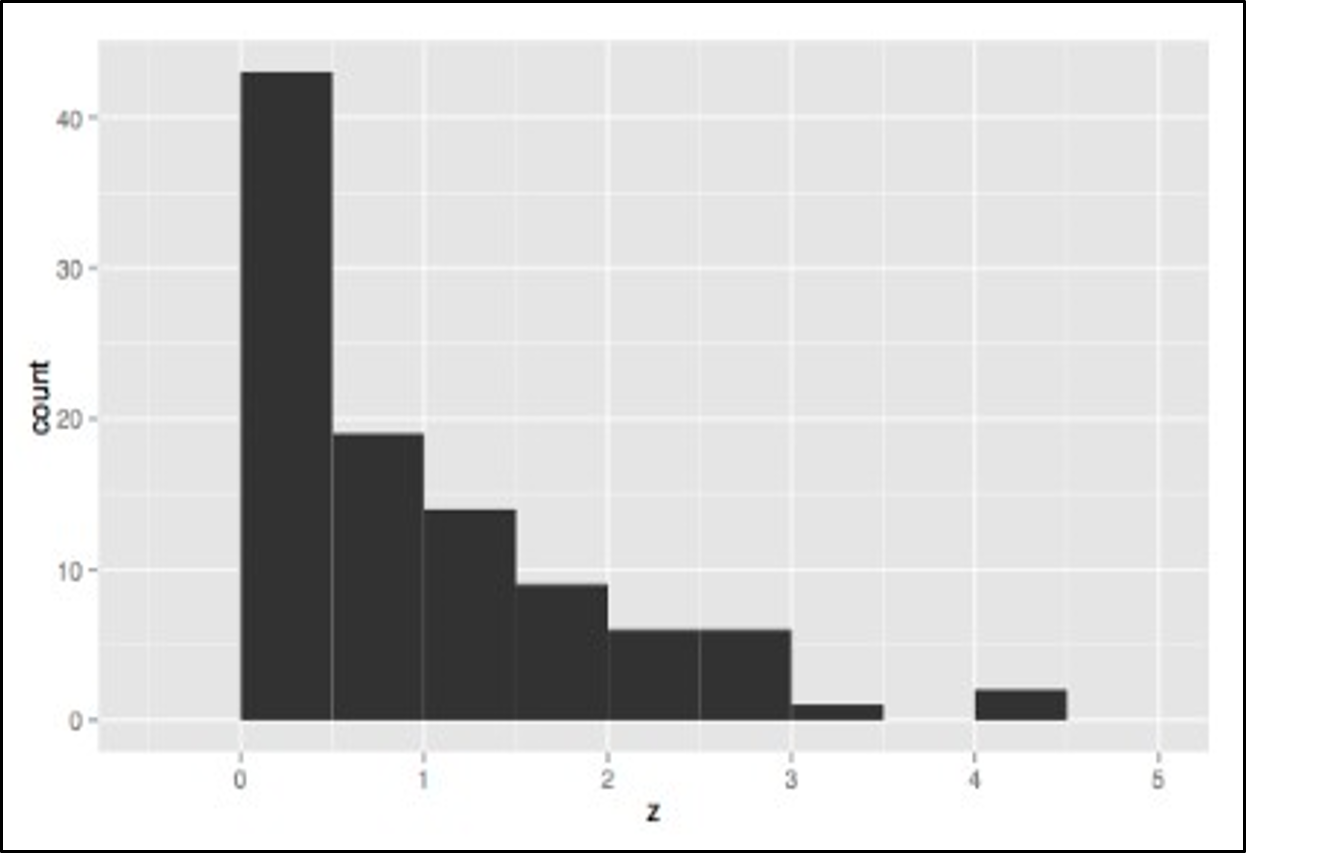
- skewed distribution with one "tail" longer than the other, to the left or to the right. (see Graph 2);
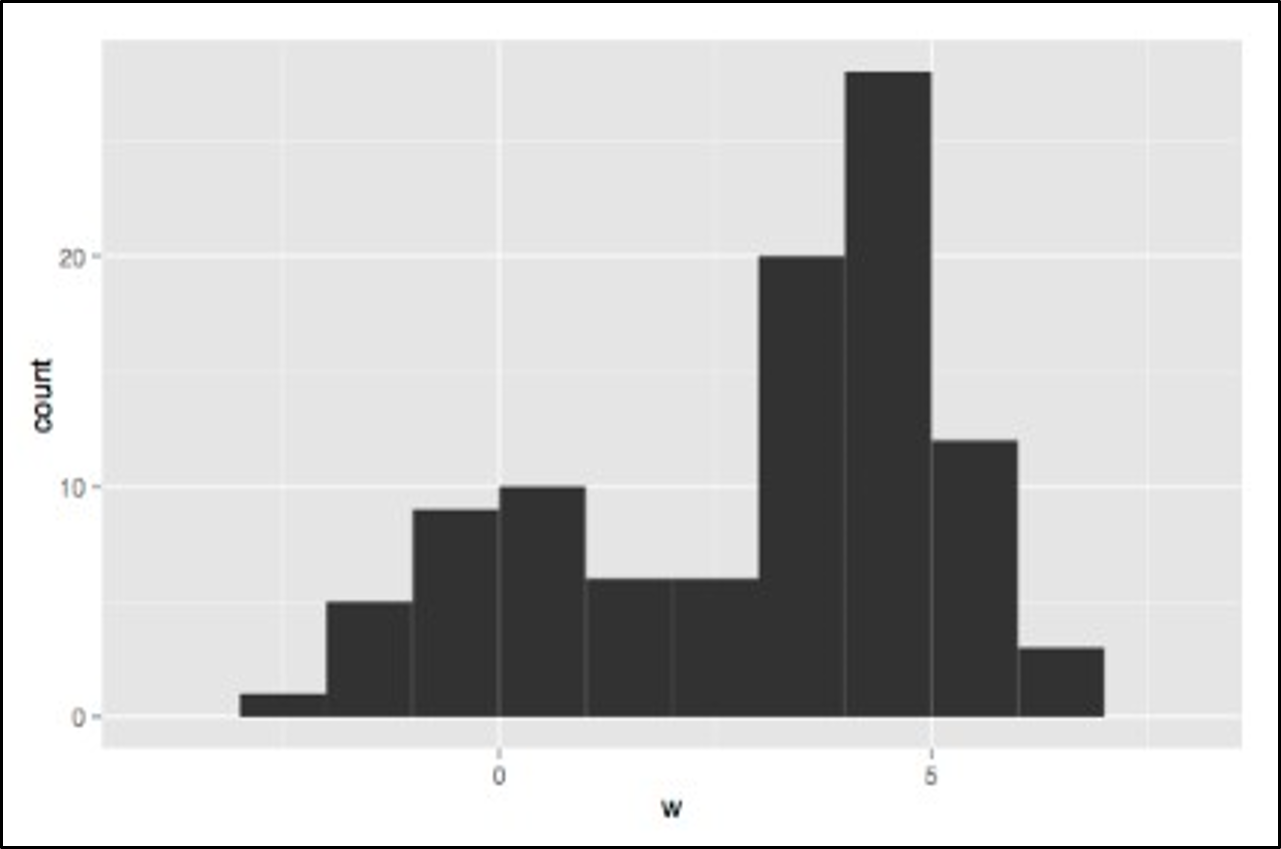
- distribution with two humps – (see Graph 3) – which most often indicates two distinct processes in the same data set;
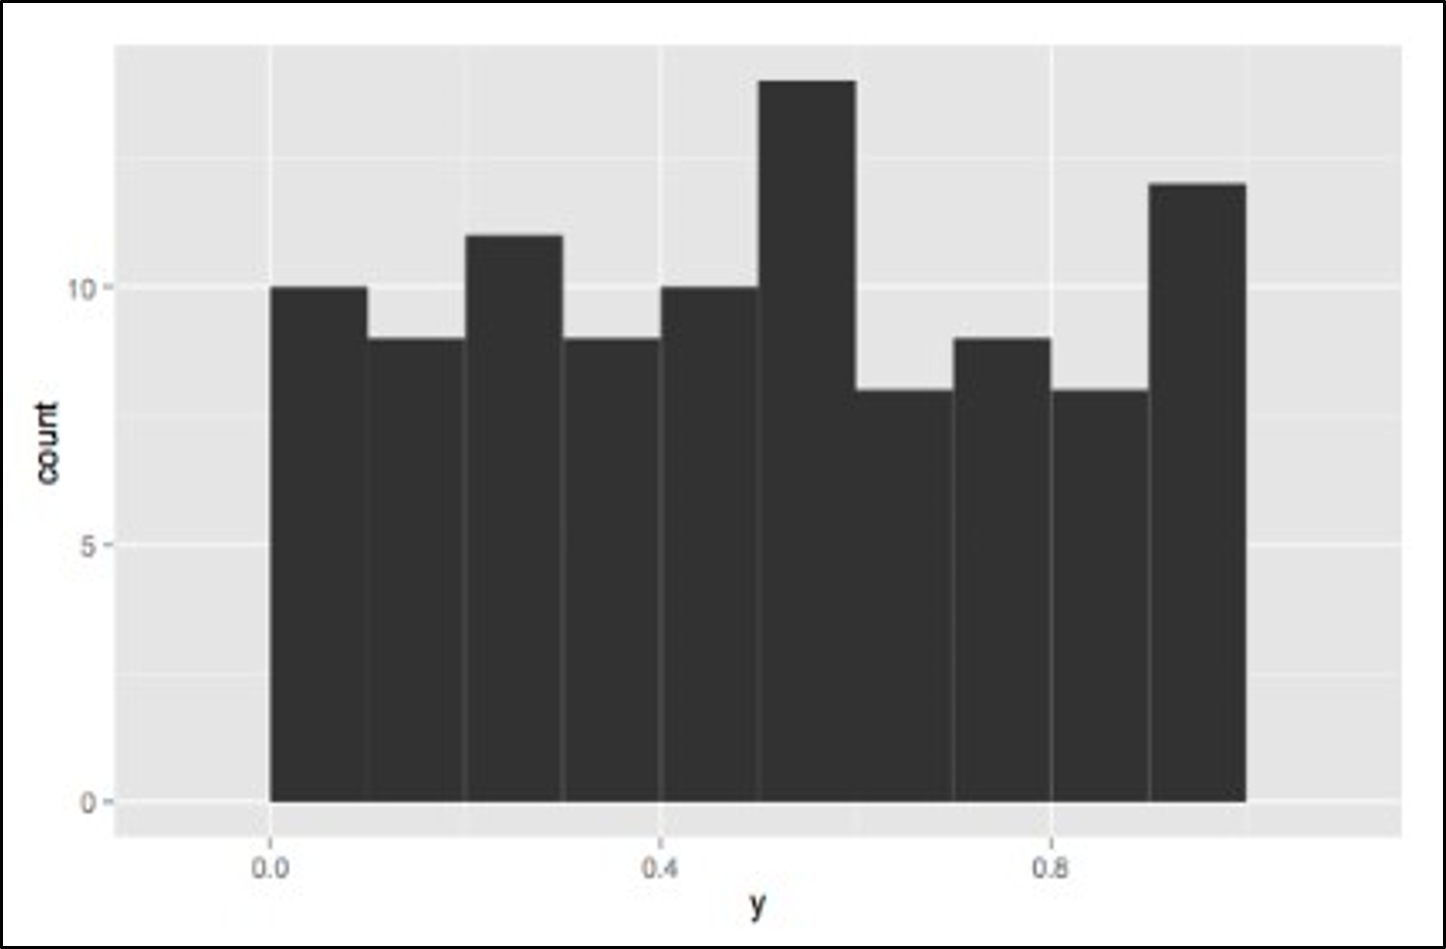
- plateau type distribution – (see Graph 4) – which means that the process is not clearly defined.
Graf 4
The histogram is one of the seven basic tools of quality control.