Regression
In statistics Regression is a statistical process that estimates relationships between variables. Regression models involve the following terms:
This way when the customer changes to a different Y, the new value of the variable x can be quickly identified so that the new requirements are met.
Regression helps us understand how the value of the dependent variable changes when any one of the independent variables varies while the other independent variables remain unchanged.
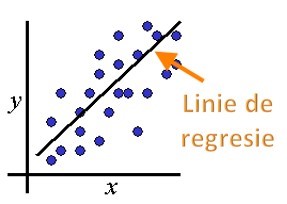
The most common type of regression is linear regression. Linear regression is an estimate of a pattern of relationship between a dependent variable Y and an independent variable denoted x.
In the next example (see graphic) we want to see if there is an influence of the size of the population "Population" (number of inhabitants) on the volume of sales "Sales". MINITAB does the analysis for us and gives us all the information we want, including the equation Y = f (x ).
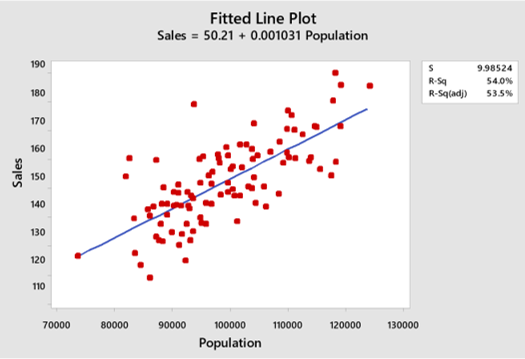
In this way, we can also calculate what are the expected sales for a certain population and we can also find out how well the equation matches reality - through R-sq [%]. The closer R-sq is to 100%, the closer the model is to perfection.
Linear regression has a limitation in its treatment of inputs (x). It can consider the relationship with only one of the variables. In real situations, however, most of the time the processes can only be modeled taking into account several variables: Y=f(x1+x2+…..+xn). In this situation we can use multiple regression.
Analysis using multiple regression is a powerful technique used to estimate the unknown value of one variable from the known values of two or more variables - also called predictors.
The term multiple regression was first used by Pearson in 1908. The multiple regression equation with several terms has the following form:
Y = b0 + b1x1 + b2x2 + ... + bkxk
In the equation, the letters represent the following:
- Independent variables, x;
- Dependent variables, Y.
This way when the customer changes to a different Y, the new value of the variable x can be quickly identified so that the new requirements are met.
Regression helps us understand how the value of the dependent variable changes when any one of the independent variables varies while the other independent variables remain unchanged.
The most common type of regression is linear regression. Linear regression is an estimate of a pattern of relationship between a dependent variable Y and an independent variable denoted x.
In the next example (see graphic) we want to see if there is an influence of the size of the population "Population" (number of inhabitants) on the volume of sales "Sales". MINITAB does the analysis for us and gives us all the information we want, including the equation Y = f (x ).
In this way, we can also calculate what are the expected sales for a certain population and we can also find out how well the equation matches reality - through R-sq [%]. The closer R-sq is to 100%, the closer the model is to perfection.
Linear regression has a limitation in its treatment of inputs (x). It can consider the relationship with only one of the variables. In real situations, however, most of the time the processes can only be modeled taking into account several variables: Y=f(x1+x2+…..+xn). In this situation we can use multiple regression.
Analysis using multiple regression is a powerful technique used to estimate the unknown value of one variable from the known values of two or more variables - also called predictors.
The term multiple regression was first used by Pearson in 1908. The multiple regression equation with several terms has the following form:
Y = b0 + b1x1 + b2x2 + ... + bkxk
In the equation, the letters represent the following:
- Y is the output variable;
- b0 is a constant;
- b1, b2, ..., bk are coefficients;
- x1, x2, ..., xk are the values of the term.