The purpose of graphical analysis
The use of the graphic method of presenting statistical data is done in order to reproduce in a simple, attractive and suggestive form the essential features of the processes studied in certain conditions of time and space.
Starting from the well-known proverb "A picture is worth a thousand words", graphical analysis has the possibility to concentrate a large amount of information in a minimal space.
From a theoretical point of view, for the same statistical data there are several possibilities of graphic representation. In practice, one will opt for that type of graph, which allows highlighting the relationships between the presented indicators.
The most widely used graphical analyzes are: Dot Plot, Histogram, Graphical summary, Time Series plot, Probability plot, Box plot, Pareto diagram and Scatter plot / X-Y graph.
Time series plot shows the values over time and Probability plot we can use it to evaluate the fit of a (normal) distribution to the data we are studying.
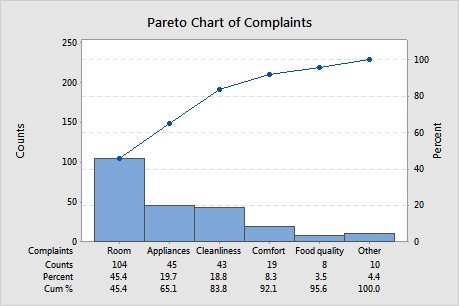
A Pareto chart is a type of chart that resembles a bar chart and a line chart, and in which individual values are represented in descending order and the cumulative total is represented by a cumulative line. The purpose of the Pareto chart is to highlight the most important factors in a set allowing for prioritization.
Scatter plot helps us determine if there is any possible relationship between two variables.
All these graphs are done using MINITAB software.
Starting from the well-known proverb "A picture is worth a thousand words", graphical analysis has the possibility to concentrate a large amount of information in a minimal space.
From a theoretical point of view, for the same statistical data there are several possibilities of graphic representation. In practice, one will opt for that type of graph, which allows highlighting the relationships between the presented indicators.
The most widely used graphical analyzes are: Dot Plot, Histogram, Graphical summary, Time Series plot, Probability plot, Box plot, Pareto diagram and Scatter plot / X-Y graph.
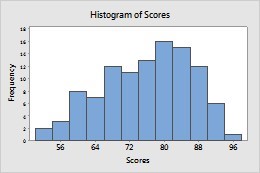
- A histogram is a graphical representation of the distribution of numerical data. The purpose of a histogram is to graphically summarize the distribution of a data set. To build a histogram we first find the minimum and maximum values then divide into equal intervals and count how many values we have in each interval. Ranges must be adjacent.
- Graphical summary gives us answers to the questions "how are the data distributed?", "how much do they vary" as well as if we have "outliers".
Time series plot shows the values over time and Probability plot we can use it to evaluate the fit of a (normal) distribution to the data we are studying.
A Pareto chart is a type of chart that resembles a bar chart and a line chart, and in which individual values are represented in descending order and the cumulative total is represented by a cumulative line. The purpose of the Pareto chart is to highlight the most important factors in a set allowing for prioritization.
Scatter plot helps us determine if there is any possible relationship between two variables.
All these graphs are done using MINITAB software.