Design of experiments (DOE)
Design of experiments (DOE) is a systematic method to determine the relationship between factors affecting a process and the output of that process. In other words, it is used to find cause -and-effect relationships. This information is needed to manage process inputs in order to optimize the output.
An understanding of DOE first requires knowledge of some statistical tools and experimentation concepts.
Although a DOE can be analyzed in many software programs, it is important for practitioners to understand basic DOE concepts for proper application. One of the most commonly used software is MINITAB.
In its simplest form, an experiment aims at predicting the outcome by introducing a change of the preconditions, which is reflected in a variable called the predictor.
The change in the predictor is generally hypothesized to result in a change in the second variable, hence called the outcome variable. DOE involves not only the selection of suitable predictors and outcomes analysis, but also planning the delivery of the experiment under statistically optimal conditions given the constraints of available resources.
For example, an engineer conducts a DOE to determine which factors affect the flight time.
If he want to analyse a process of flight time (typical example of paper helicopters), there are three aspects of the process that are analyzed by a designed experiment:
- Factors, or inputs to the process. Factors can be classified as either controllable or uncontrollable variables. Potential factors can be identified using the Fishbone Chart (Cause & Effect Diagram), SIPOC (or IPO), or other tools; In the choosed example the factors can be paper type, rotor length, leg width and existence or not of paper clip;
- Levels, or settings of each factor in the study;
- Response, or output of the experiment. For choosedd example is the flight time (seconds).
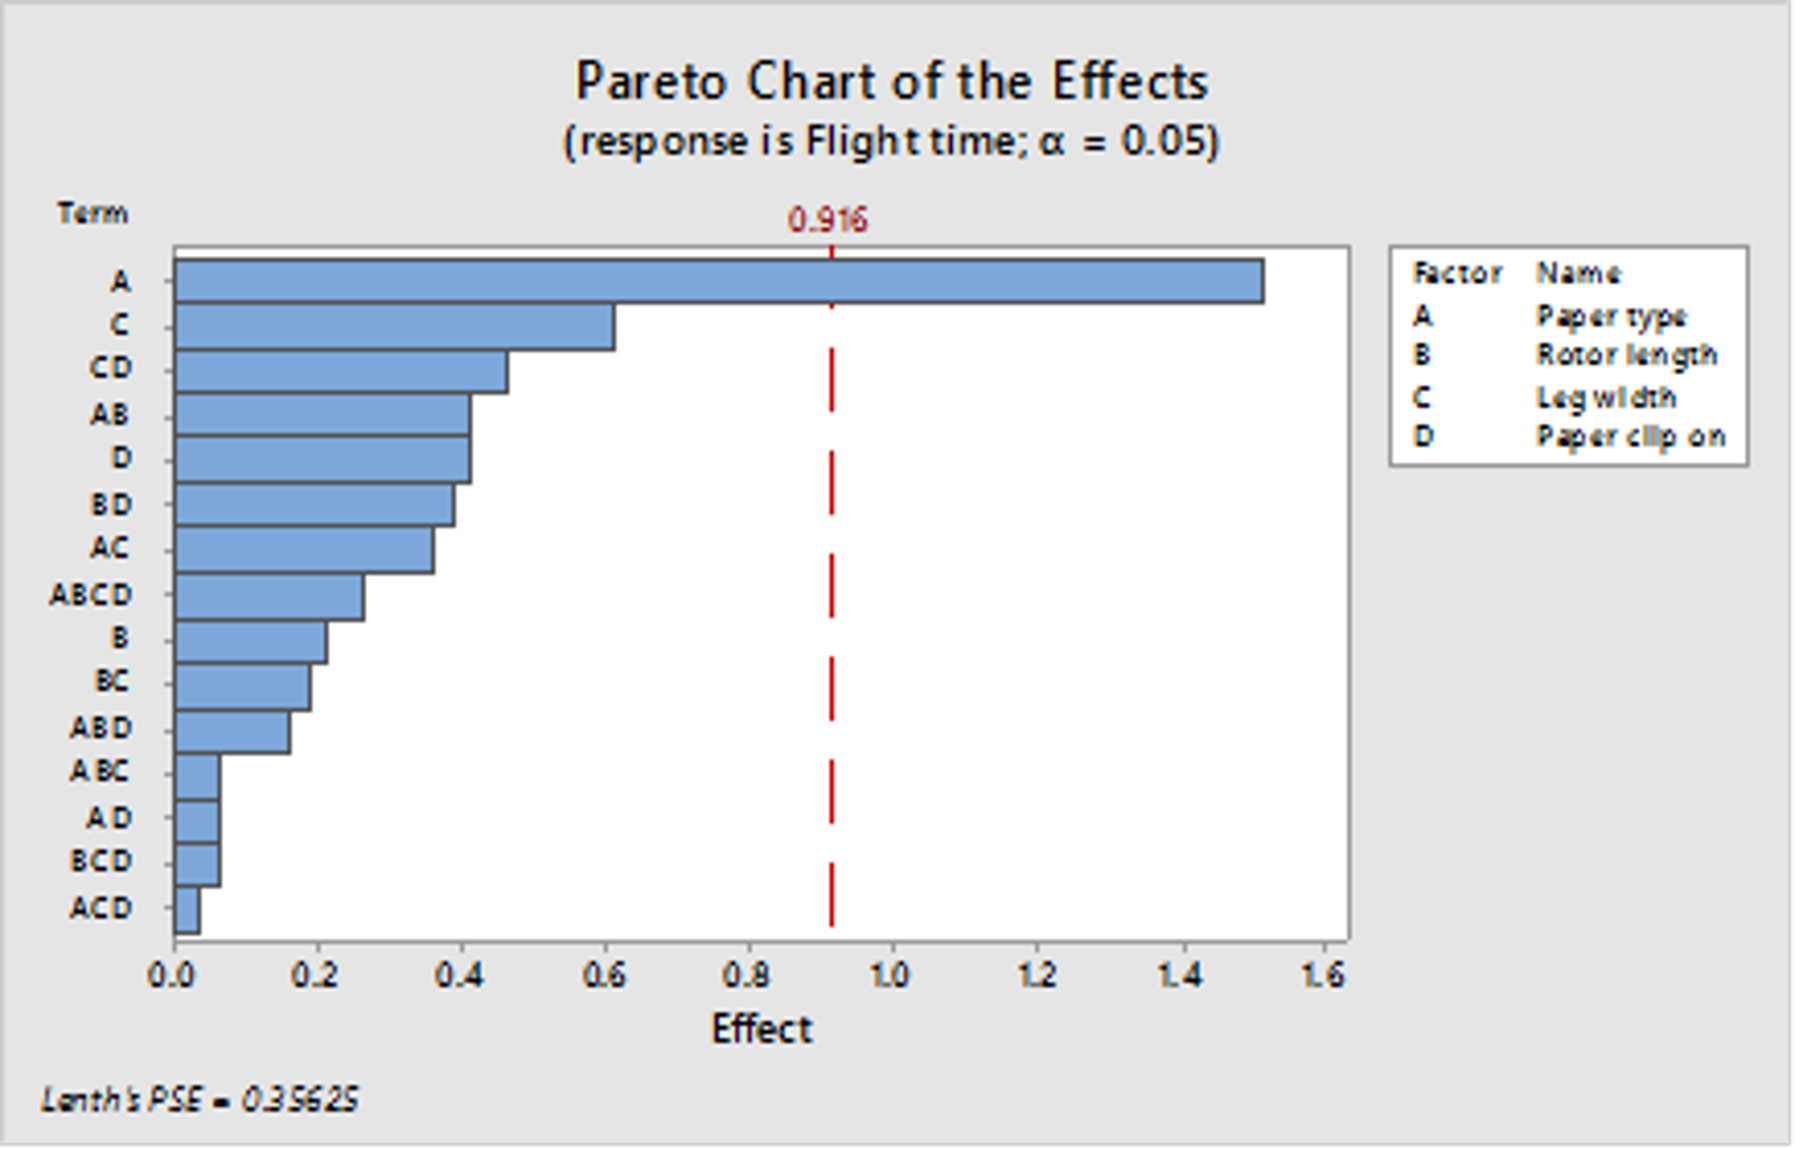
He identifies three statistically significant factors and want to graph the results to show to the management team. The factor that most influences is paper type (see Graf 1). He use Factorial Plot to visualize how the factors affect the response.
Graf 1
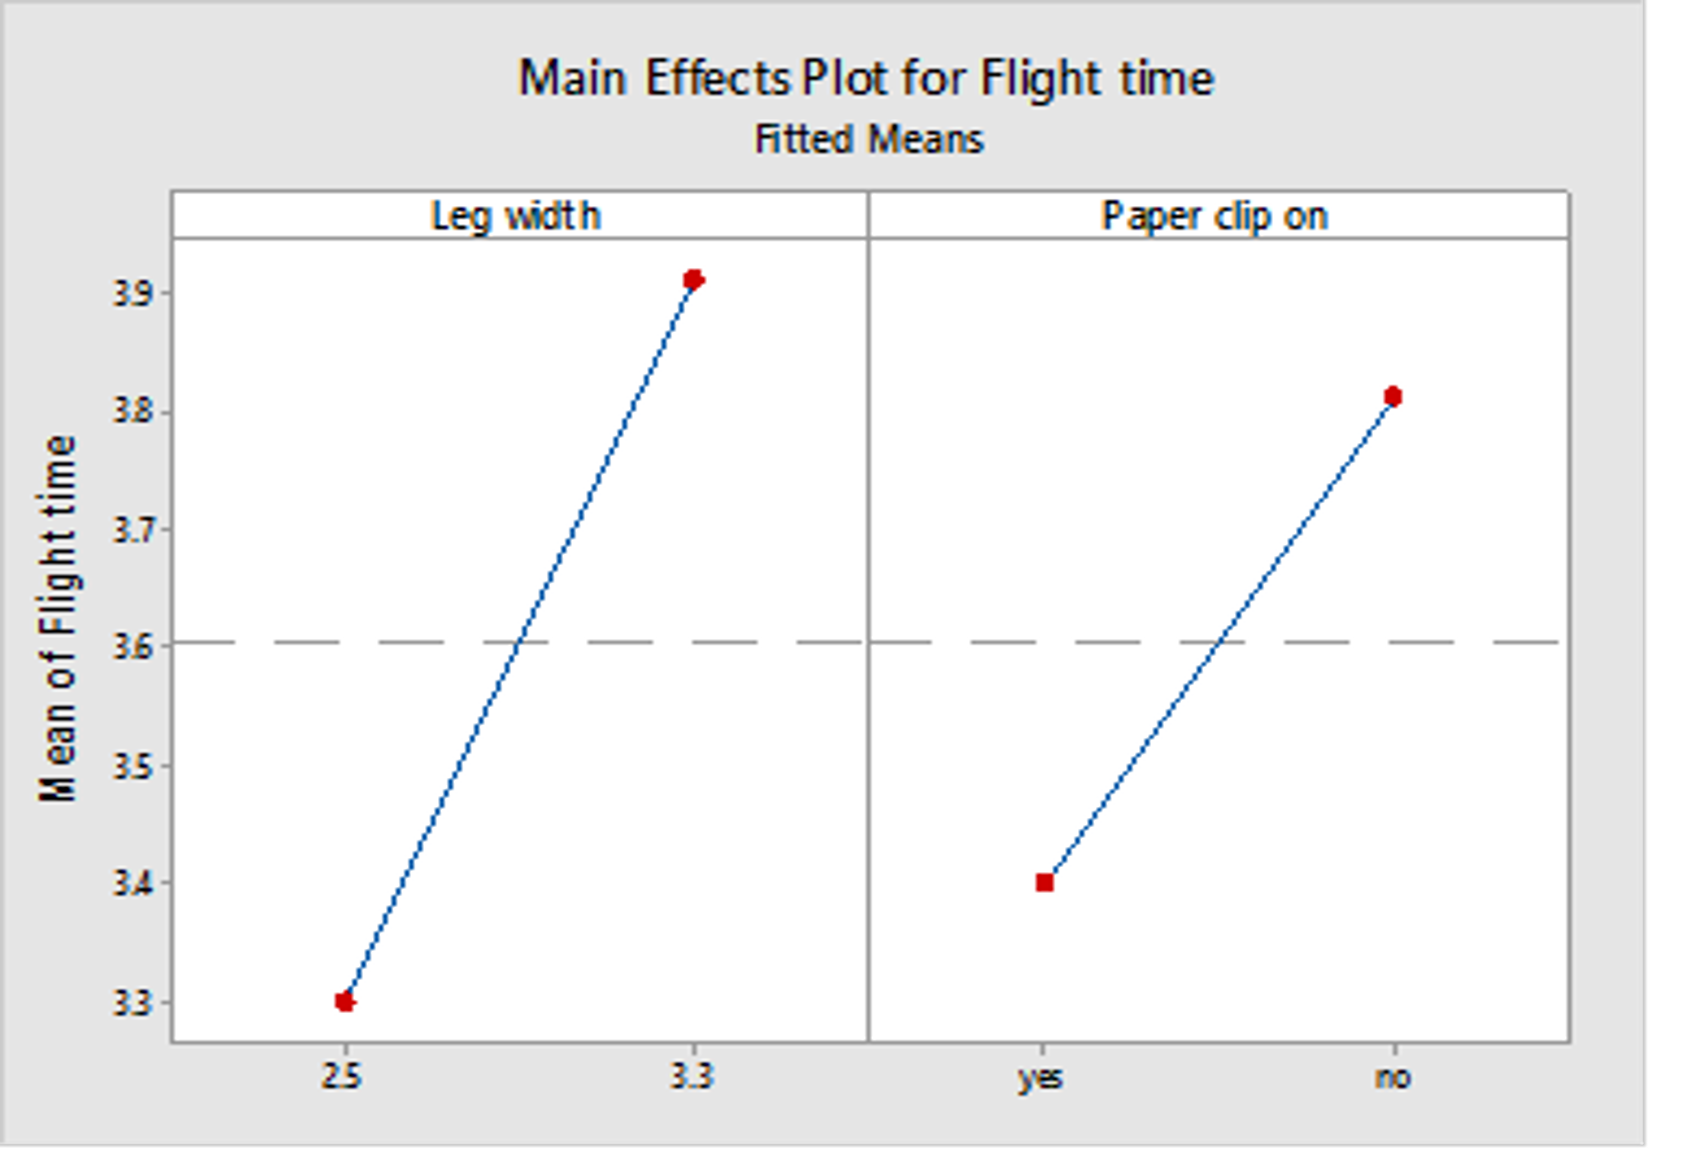
Main Effects Plot displays the mean response at each level of each factor (see Graf 2).
Graf 2
Interaction Plot displays the mean response at each combination of levels from two factors (see Graf 3).
Graf 3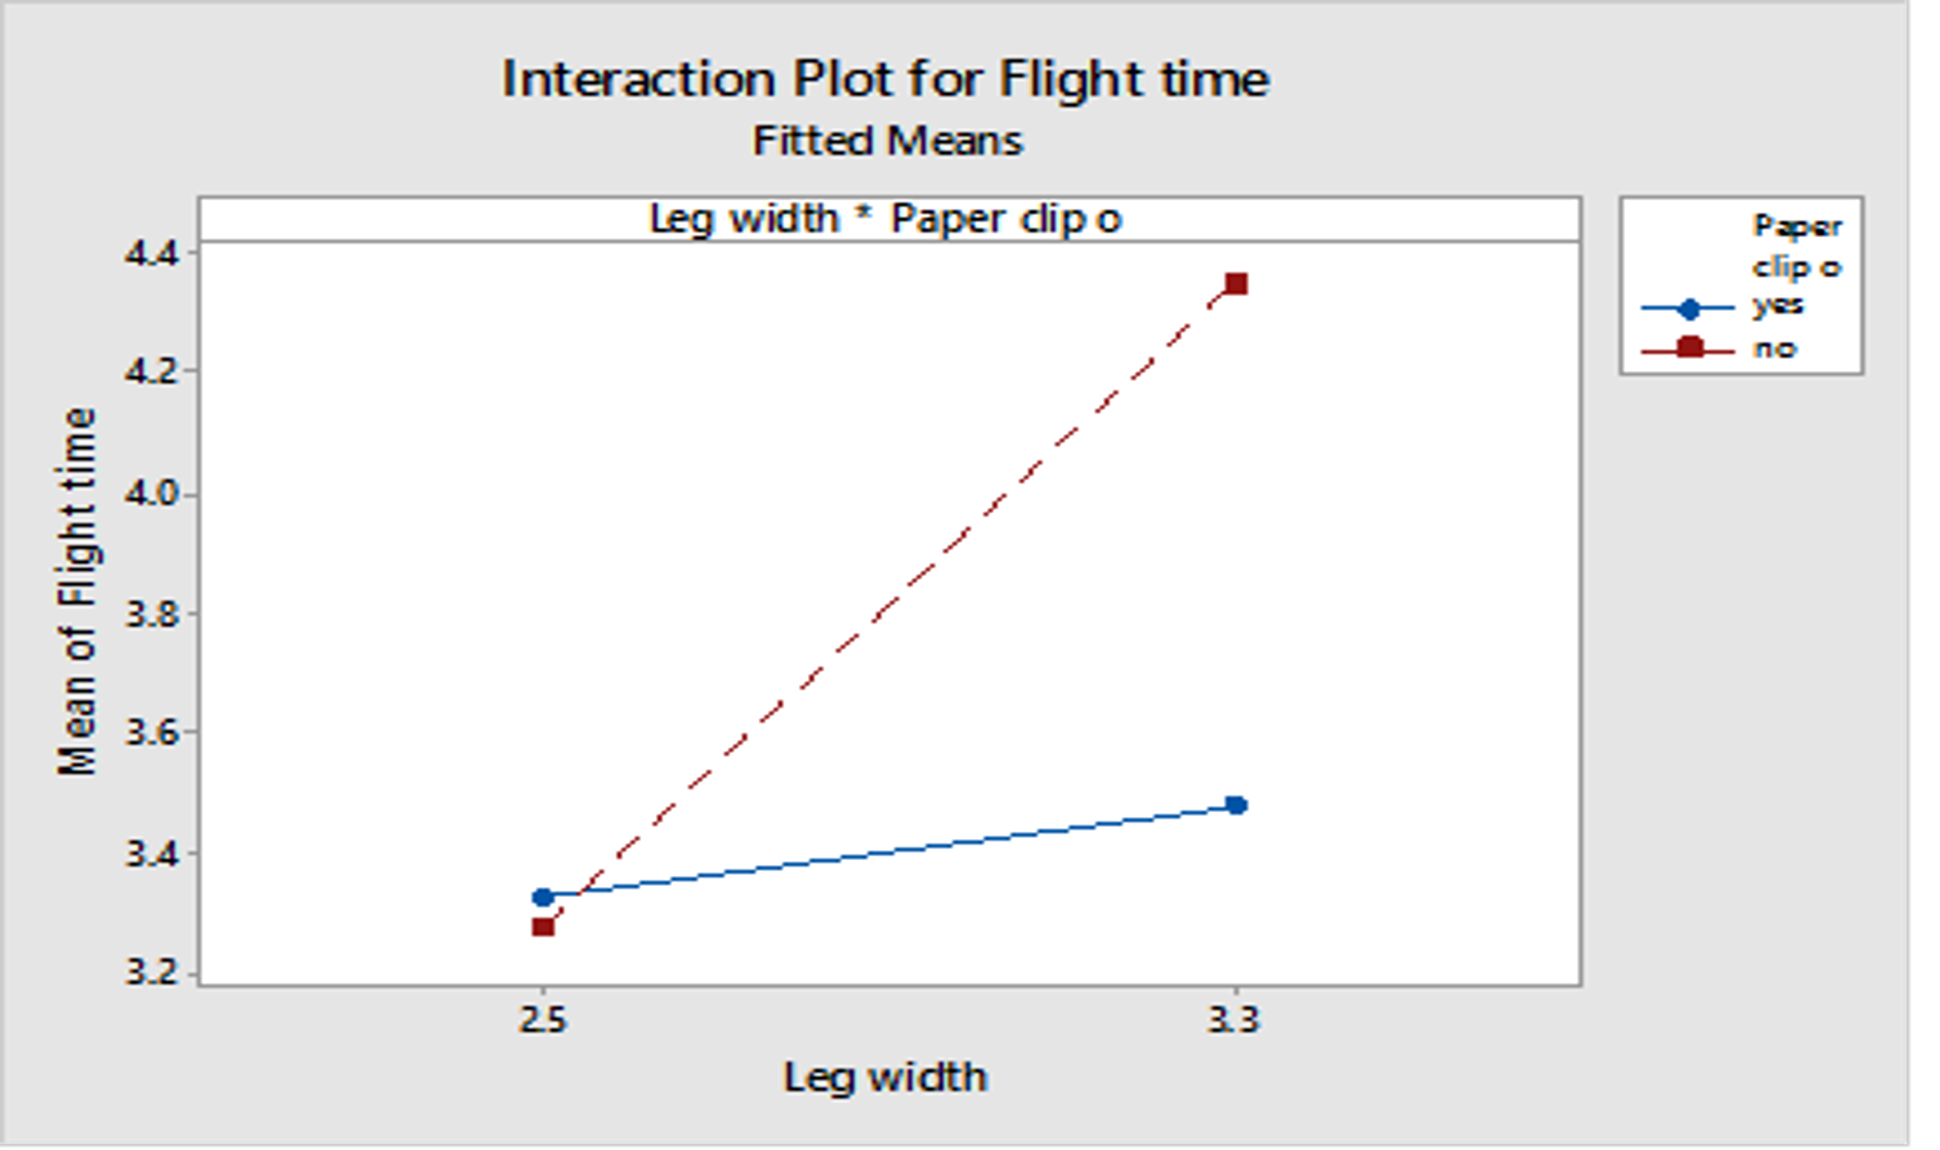
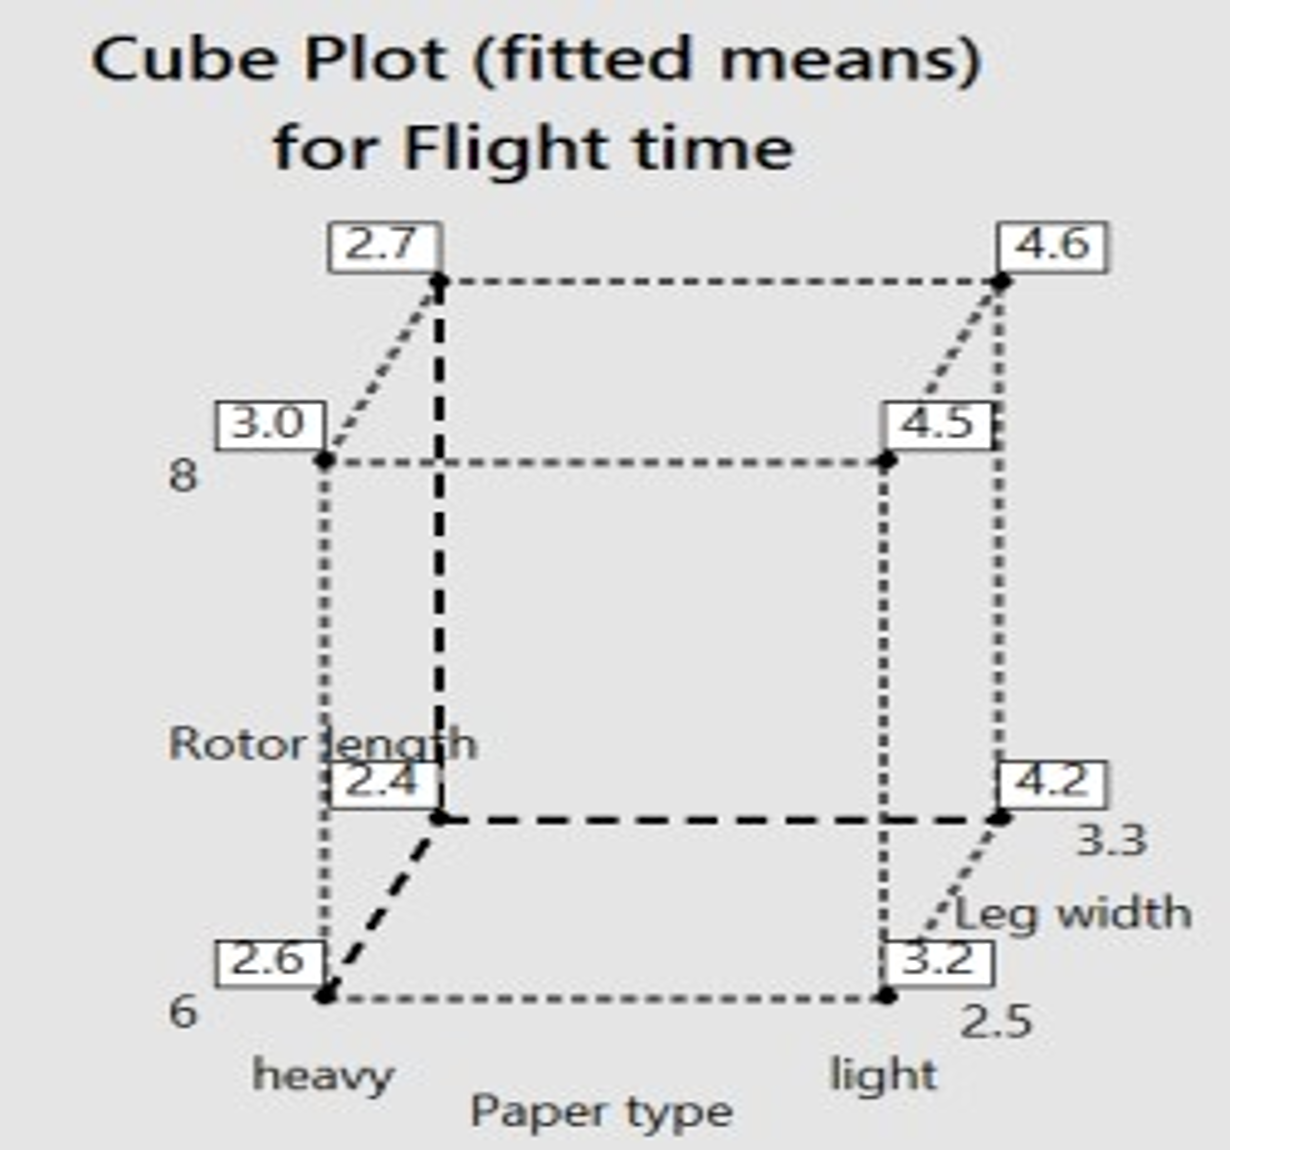
Cube plot displays the mean response at each factor level combination for up to eight factors (see Graf 4).
Graf 4